Stage-weighted projection
Mandate-signed deals weighted differently from cold leads. Each stage has its own historical conversion probability.
See next month's commission before it happens.
Built for Western Cape estate agents working Sea Point, Camps Bay, Constantia, and beyond, pipeline forecast draws on the same live SA Deeds Office data that powers RealtyPA across the country, with the radius, comparables, and market context that Western Cape actually needs.
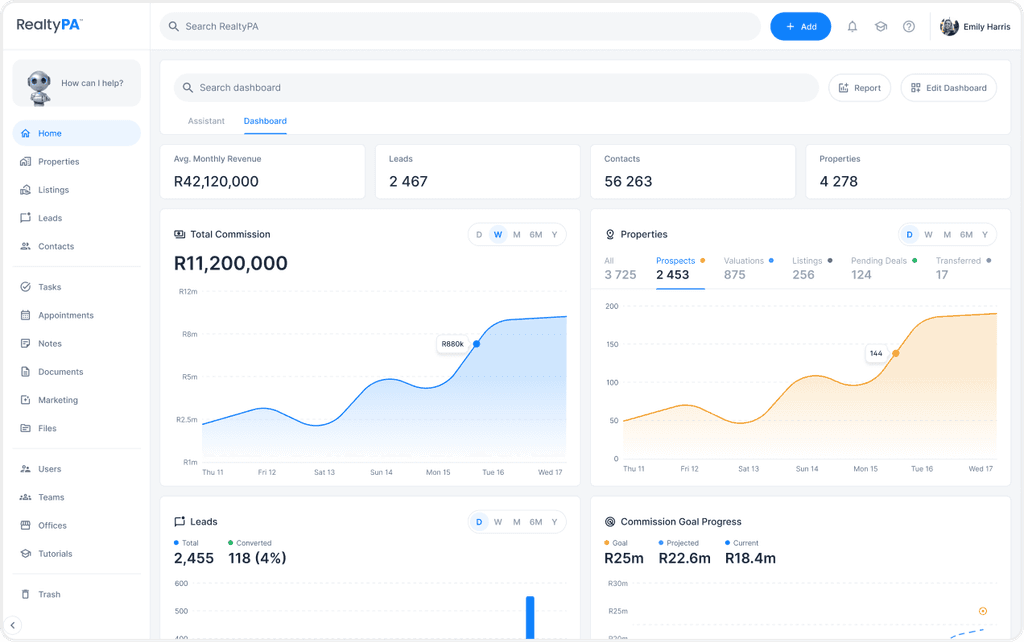
Mandate-signed deals weighted differently from cold leads. Each stage has its own historical conversion probability.
Not just a number, a confidence range. "Expected R280k commission, with 80% confidence between R210k and R350k."
Each month compares your forecast to actual. The model self-tunes against your real conversion patterns.
Yes, Western Cape has ~~2.4M registered erven, all in our database. Pipeline Forecast has the same depth of data here as in any SA province. Coverage is strongest in active suburbs like Sea Point, Camps Bay, Constantia, and beyond; sparser-volume areas may have fewer comparables to draw from. Median Western Cape price is R2.1M, a useful benchmark.
Accuracy improves as the model learns your own conversion rates. Established agents with several months of history see the tightest ranges; newer agents start from aggregate patterns.
Yes, agency-level forecast is the sum of per-agent forecasts plus shared deals. Useful for staffing decisions and growth planning.
Yes, December/January in SA traditionally slows down for residential. The forecast accounts for these patterns based on your historical data.

Start with 30 days free and 5 property reports. No card required.